 From Foundry Labs

What is driving Bitcoin now?
A situation report on the fall from US$124,753, the Binance theft, a hawkish Fed hold, the AI trade and the rules, with market data to 31 October 2026
Abstract
Bitcoin closed at US$77,226 on 31 October 2026, 38% below its 6 October 2025 peak of US$124,753 and 32% above its 30 June 2026 low of US$58,559. The last week added three shocks: a Federal Reserve that held at 3.75 to 4.00 per cent with two dissents in favour of a hike, a record US$6.3 billion theft from Binance on 29 October, and a tech sell-off tied to doubts about the cost of financing artificial-intelligence capacity. We sort the drivers by how well the evidence supports them. Market data show that Bitcoin now moves with the Nasdaq and gold, not against them (63-day correlation with the Nasdaq-100 fund QQQ 0.41, with gold 0.49), but that link explains little of the year's fall: over the last 252 trading days a regression on Nasdaq, dollar and 10-year yield changes has an R² of 0.21 and leaves about 38% of the decline unexplained while the Nasdaq rose. The hack cost -4.3% on the day, a move that happens on about 3% of days since 2023, and the Fed day itself moved Bitcoin +0.6%. Chip stocks (SMH +53% since the Bitcoin peak) have taken the money that Bitcoin lost, and listed miners now trade more like AI infrastructure than like Bitcoin. Technical signals are mixed and none of the common chart claims survives a proper test on 16 years of Bitcoin history. The honest summary is that rates, tech sentiment and a plumbing shock explain this week, while a slow loss of the institutional-demand story explains the year.
Key points
- Bitcoin is 38% below its peak after 390 days. At the same age the 2013, 2017 and 2021 cycles were 73%, 81% and 75% below their tops, so this drawdown is shallower than earlier ones (three cycles only).
- The macro link has tightened: 63-day correlation 0.41 with the Nasdaq, 0.49 with gold (long-run 0.11), -0.31 with the dollar. But Nasdaq, dollar and yield changes explain only 21% of daily variation over a year.
- The Fed held at 3.75 to 4.00% on 28 October with two dissents for a hike; September CPI was 3.7% and a December hike is the market's base case (sources, not our data). Bitcoin rose +0.6% on the decision day and fell on the hack the day after.
- The Binance theft (about US$6.3 billion, attributed to North Korea's TraderTraitor by Chainalysis and TRM) cost -4.3% that day. Earlier exchange failures show no common after-effect, and five events cannot separate the hack from the market around it.
- The AI trade is a competitor for capital, not a tailwind: since the peak SMH is +53% and Bitcoin -38%. Miners' returns track chips (126-day correlation 0.70) more than Bitcoin (0.39).
- Regulation is a slow headwind rather than a driver of the week: the market-structure bill failed a Senate procedural vote 49 to 50 on 15 September, rules from the SEC and CFTC are at the proposal stage, and the US midterm election is on 3 November.
Keywords: Bitcoin, macro correlation, Federal Reserve, exchange hack, AI trade, crypto regulation, technical analysis, market structure
- 1. The short answer
- 2. Where Bitcoin stands
- 3. The week: Fed, inflation and the AI-financing wobble
- 4. The Binance theft
- 5. Artificial intelligence: tailwind, rival or neither?
- 6. Bitcoin and the macro backdrop
- 7. Regulation and policy
- 8. Demand, flows and positioning
- 9. The technical picture
- 10. What would change the picture
- 11. Limits
- 12. Conclusion
- A. Sources and reliability
- References
01 · The short answer
The question has two parts that need different answers: why did Bitcoin fall this week, and why is it 38 per cent below its high a year on? This week has three visible causes. The Federal Reserve held rates on 28 October but two members wanted to raise them, so a hike in December is now the base case in market commentary. Technology stocks sold off on worries that borrowing costs would choke the build-out of AI capacity, and Bitcoin, which trades with technology at the moment, went with them. On 29 October Binance, the largest exchange, lost about US$6.3 billion to a hack, and Bitcoin fell 4.3 per cent. Leveraged buyers were then forced out, with about US$1.3 to 1.5 billion of long positions liquidated in a day.
The year's fall has a different cause, and the data say it is mostly specific to crypto. Over the same twelve months the Nasdaq rose, and a model built on Nasdaq, dollar and yield moves explains about a fifth of Bitcoin's daily changes and none of the drift. What is left is the slow unwinding of the story that carried Bitcoin to US$125,000 in October 2025: continuous exchange-traded-fund buying, corporate treasuries that bought on a premium to their holdings, and the prospect of clear US law. Each of those has weakened. The rest of this paper sets out the evidence for each driver and how much weight it can bear.
| Driver | What happened | Evidence in our data | Weight |
|---|---|---|---|
| Fed and inflation | Hold at 3.75-4.00% with 2 dissents for a hike; CPI 3.7%, PCE 3.6% | 10-year yield peaked 5.31% on 5 Oct, now 4.93%; BTC +0.6% on the decision day | Medium: sets the backdrop; the day itself was a non-event |
| Tech and AI-financing worries | Nasdaq -2.6% on 22 Oct; Meta, CoreWeave, Nvidia down | 63-day correlation with QQQ 0.41; 21-day 0.57 | Medium to high for weekly moves |
| Binance theft | About US$6.3bn taken 29 Oct; US$2.8-3bn frozen | Day -4.3% (z -2.4); liquidations about US$1.3-1.5bn | High for 29-30 Oct; unknown after |
| Institutional demand | ETF flows choppy; Strategy stopped buying, others stepped in | Not in our data; flows are from third-party reports | High for the year, uncertain this week |
| Regulation | CLARITY Act failed 49-50 on 15 Sep; SEC and CFTC proposals open | BTC -3.3% on 15 Sep, then +10% over 20 days | Low to medium: a slow headwind |
| Technicals and positioning | Below 50-day, at the 200-day average; weekly RSI 51, daily 34 | Levels reconciled to third-party quotes within 1%; no tested chart claim holds | Low: they describe, they do not predict |
02 · Where Bitcoin stands
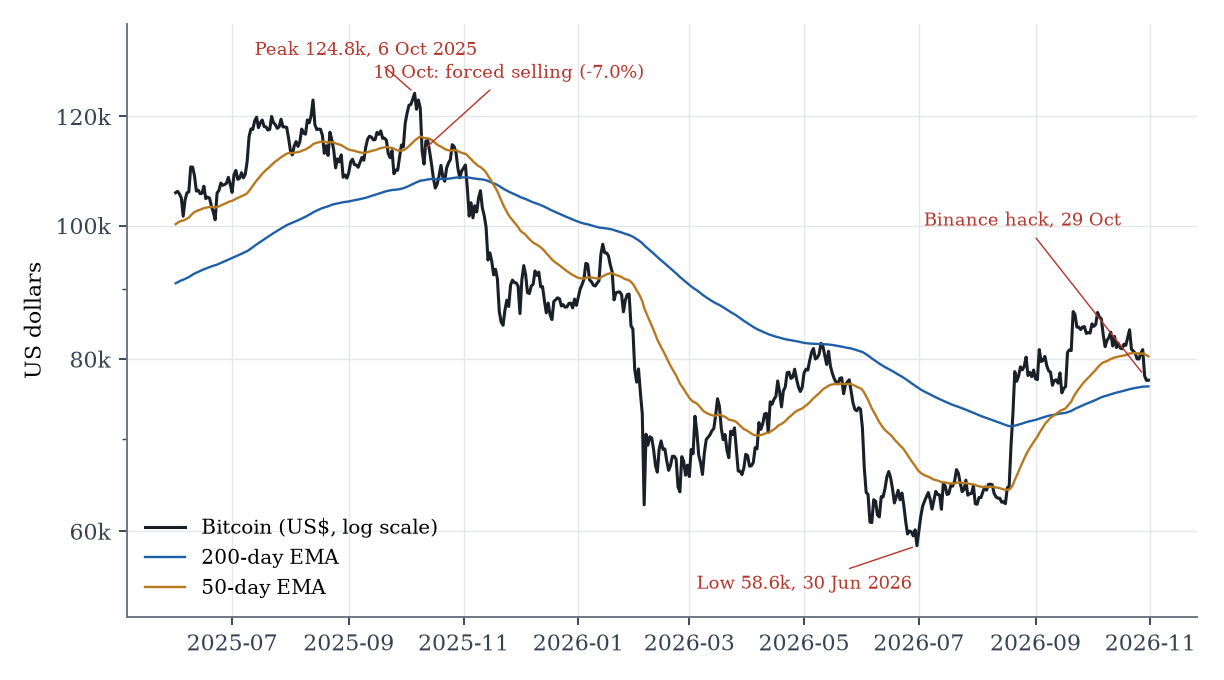
| Month end | Close | Change in month | What was happening (sources in Appendix) |
|---|---|---|---|
| Oct 2025 | US$109,556 | -3.9% | Peak 6 Oct; 10 Oct liquidation cascade |
| Nov 2025 | US$90,394 | -17.5% | |
| Dec 2025 | US$87,509 | -3.2% | Year-end close |
| Jan 2026 | US$78,621 | -10.2% | |
| Feb 2026 | US$66,996 | -14.8% | |
| Mar 2026 | US$68,233 | +1.8% | |
| Apr 2026 | US$76,304 | +11.8% | |
| May 2026 | US$73,580 | -3.6% | Local high: about US$82.7k reported (our closes peak at US$82.1k on 10 May) |
| Jun 2026 | US$58,559 | -20.4% | Fed leans to hikes; ETF outflows; Strategy pivot; quarter-end; low US$58.6k |
| Jul 2026 | US$62,814 | +7.3% | Treasury companies under pressure (mNAV under 1) |
| Aug 2026 | US$78,549 | +25.1% | Strong recovery (no cause sourced) |
| Sep 2026 | US$83,554 | +6.4% | Yield surge; CLARITY Act fails 15 Sep; 10-year at 5.3% |
| Oct 2026 | US$77,226 | -7.6% | AI-financing doubts, hawkish Fed, Binance theft |
2.1 This cycle against earlier ones
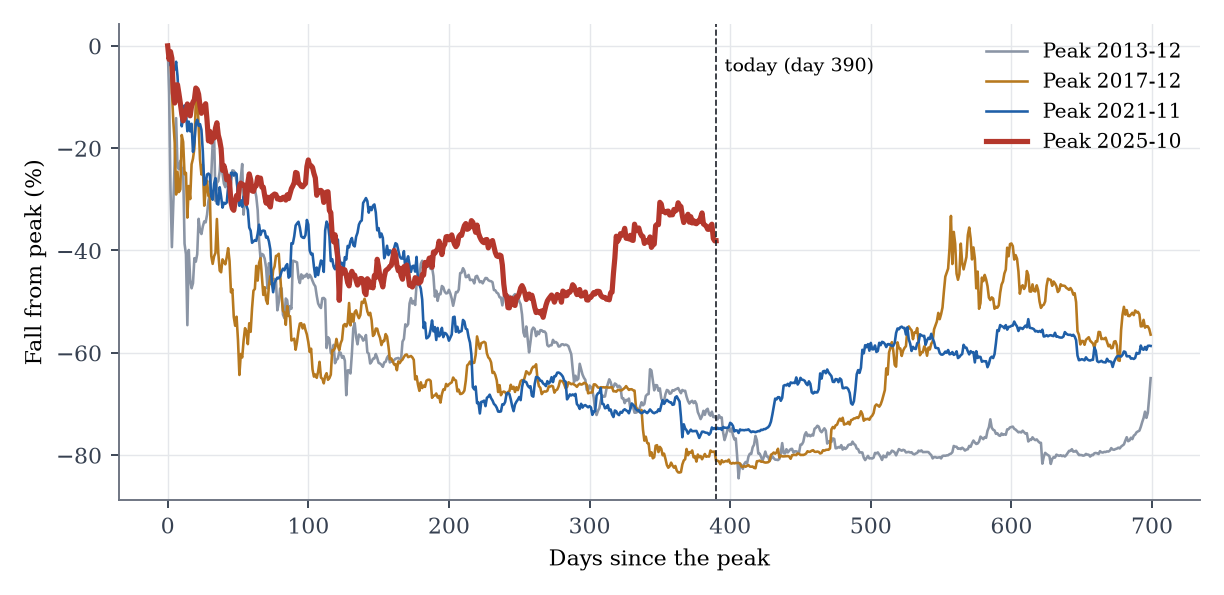
Three earlier cycles ended with falls of 77% to 85% from peak, reached 364 to 406 days after the top. This one reached a fall of 53% at day 267 and has recovered. Two readings are possible. A bull reading is that institutional ownership has made drawdowns shallower. A bear reading is that the long bear phase of earlier cycles is yet to come, with a lower low before the next high. With three prior cycles the data cannot choose between them, and anyone who states the answer with confidence is going beyond the evidence.
03 · The week: Fed, inflation and the AI-financing wobble
3.1 Fed and inflation
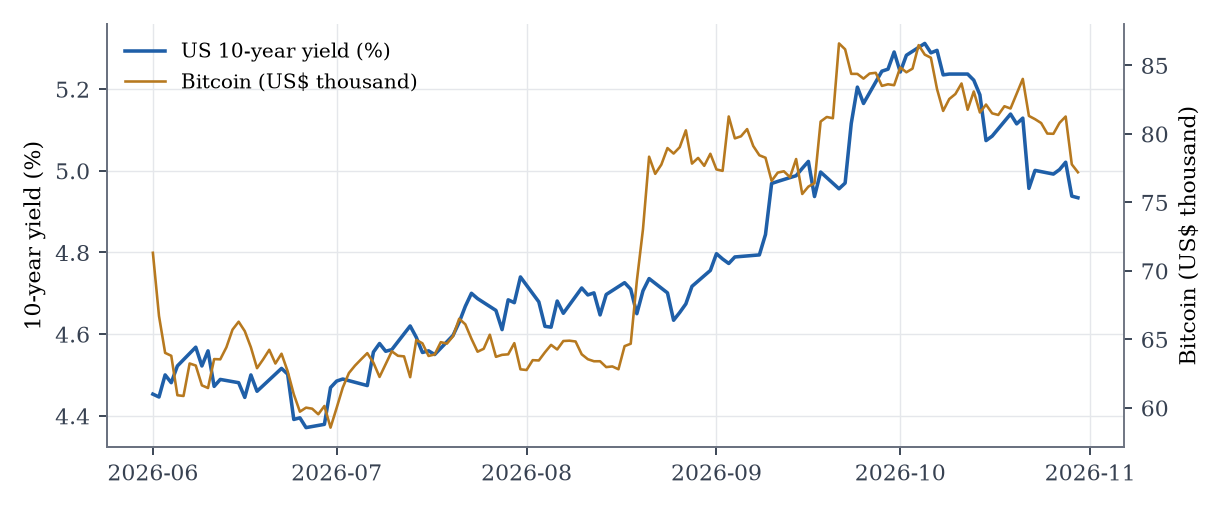
The Federal Reserve held its policy rate at 3.75 to 4.00 per cent on 28 October. Two members, Governor Lisa Cook and Cleveland Fed President Beth Hammack, voted for a quarter-point rise, so the vote was 10 to 2. September consumer prices rose 3.7 per cent over the year against 3.6 expected, and the Fed's preferred price measure was 3.6 per cent (core 3.1 per cent) with third-quarter growth of 3.4 per cent annualised. That combination of strong growth and inflation above target is why futures and several banks now treat a December hike as the base case, with one bank expecting cuts only to start in mid-2027.
Bitcoin's reaction to the decision itself was a non-event: +0.6% on the day, a z-score of 0.3 against its own 60-day daily volatility. A Foundry Labs event study of 85 Fed decision days since 2016 found Bitcoin's absolute move was only 1.11 times that of other days (permutation p = 0.19), against 1.26 times on CPI days (p = 0.009). So scheduled data have carried more information for Bitcoin than the meeting itself. This October the sequence was: a 1.8 per cent dip on the CPI day (14 October), a rally to above US$84,000 by 21 October, a fall with technology stocks from 22 October, then the hack. The hawkish dissents added to a drift that was already under way.
3.2 Technology and the cost of financing AI
The second source of weakness is the equity market. On 22 October the Nasdaq Composite fell 2.6 per cent and the S&P 500 1.2 per cent, its worst day since July. Meta fell 7 per cent after announcing a new share class to raise money for AI projects, CoreWeave fell 10 per cent (its bonds were reported to yield close to 16 per cent a week earlier) and Nvidia fell 4.4 per cent. The argument circulating among analysts is that yields above 5 per cent raise the cost of the debt that funds data centres, which hits the AI build-out and the stocks tied to it. Bitcoin joined the fall. The VIX rose from about 15 in mid-October to 19.4 on 30 October; the dollar index stands at 102.0, against 98.1 at the Bitcoin peak.
Index levels, yields and correlations are from our own data (EODHD). Economic releases, Fed votes, company announcements and flow numbers come from news sites and crypto-industry reports, several of which disagree with each other on small figures or look machine-written. Where sources conflicted we used the figure two sources agreed on and said so; all sources are listed with a reliability note in the Appendix.
04 · The Binance theft
From about 4:20 pm New York time on 29 October, funds left Binance hot wallets across several blockchains. Chainalysis puts the total at about US$6.4 billion; Binance and TRM Labs say US$6.3 billion and US$6.36 billion. That makes it the largest theft in crypto history, roughly four times the US$1.5 billion Bybit hack of February 2025. Binance says the attack began with a compromised laptop used by an engineer, which let the attacker submit unauthorised withdrawals through a service container; Chainalysis describes signed authorisations that let a hot wallet run attacker-deployed code. Both Chainalysis and TRM attribute it to TraderTraitor, a North Korean state-linked group, partly because the stolen funds mingled on-chain with funds from last month's Bitget theft. That attribution is an intelligence judgement and not a finding of fact.
The response has been fast by the standards of past hacks. Freezes began within an hour (Circle and Tether were reported among those freezing funds), and about US$2.8 to 3 billion has been frozen so far. Binance suspended deposits and withdrawals, said it would cover all losses from its SAFU fund and company reserves, and analysts quoted in the press said it did not appear to threaten Binance's solvency. The attacker meanwhile moved US$500 million of stablecoins through a swap wallet and converted US$325 million of it into US$285 million of ether within about twenty minutes, so part of the loss is likely to be permanent.
| Event | Date | Bitcoin on the day | Move in daily-volatility units | 5 days | 20 days | 60 days |
|---|---|---|---|---|---|---|
| Bitfinex hack (about 120,000 BTC) | 2016-08-03 | +3.5% | +0.9 | +8% | +7% | +12% |
| Binance hack (7,000 BTC) | 2019-05-08 | +2.6% | +1.0 | +34% | +50% | +96% |
| FTX collapse | 2022-11-09 | -14.3% | -5.7 | -10% | -11% | -8% |
| Bybit hack (US$1.5bn) | 2025-02-21 | -2.2% | -1.1 | -14% | -18% | -5% |
| Binance hack (US$6.3bn) | 2026-10-29 | -4.3% | -2.4 | n/a | n/a | n/a |
Bitcoin's -4.3% on the day was a 2.4-sigma move. It is large but not unusual in Bitcoin's own history: since 2023 it has fallen 4.3 per cent or more on 3.2% of days. The FTX collapse hit Bitcoin by 14 per cent in a day and did lasting damage because it revealed a hole in a lender's balance sheet and set off a chain of failures; this time there is no such hole in view. Whether the theft matters for more than a day depends on three things the data cannot yet show: whether Binance reopens withdrawals without a run, whether the frozen money is recovered, and whether regulators use the event to tighten rules on exchanges.
05 · Artificial intelligence: tailwind, rival or neither?
The AI boom touches Bitcoin in three ways, and the evidence points in different directions for each.
- As a sentiment channel. Bitcoin's 63-day correlation with Nvidia is 0.30 and with the semiconductor fund SMH 0.31; over the last 21 days 0.52 and 0.48. When AI stocks fall, Bitcoin tends to fall with them, but the link is weaker than with the broad Nasdaq (0.41).
- As a competitor for capital. Since Bitcoin's peak on 6 October 2025 the semiconductor fund SMH has risen 53%, Nvidia 11% and the Nasdaq-100 fund 14%, while Bitcoin fell 38%. Several analysts argue the speculative money that chased Bitcoin in 2024 and 2025 moved to AI names. Our data show the divergence but cannot show where the money went.
- As a source of revenue for miners. Miners are signing contracts to host AI computing. A CoinShares projection quoted in the press says listed miners could earn up to 70 per cent of revenue from AI by December 2026, up from about 30 per cent, and most large miners were reported to break even near US$90,000 a coin in the third quarter. Hash rate is reported to have fallen from a recent high, though the figures we found conflict (0.888 zetahashes and 920 exahashes per second were both quoted). Fewer machines on the network is consistent with miners preferring AI hosting to Bitcoin at today's prices.
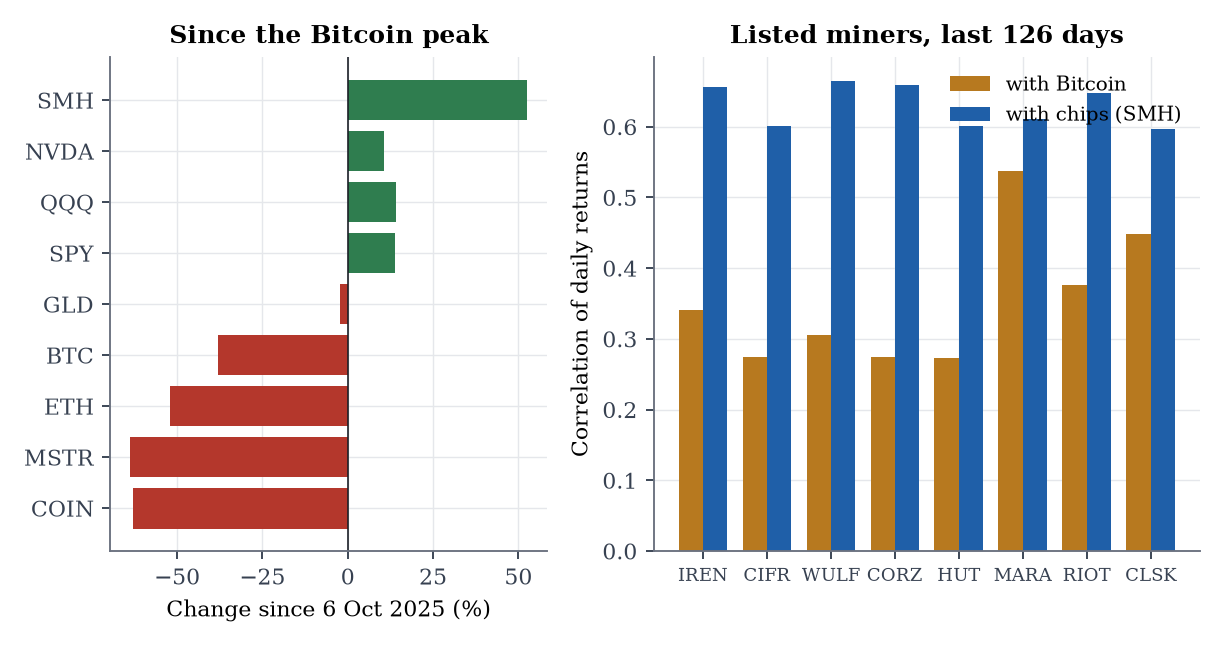
The miner result is the cleanest AI link in our data. Over 126 days, the equal-weighted miner basket has a correlation of 0.70 with SMH and 0.39 with Bitcoin. The pure Bitcoin miners (MARA, CLSK) correlate more with Bitcoin (0.54 and 0.45) than the AI-hosting group does, though they too track chips more; those that rebuilt around AI hosting (IREN, CIFR, WULF, CORZ, HUT) sit at 0.27 to 0.34. Hut 8 is up 43% since the Bitcoin peak while MARA is down 67%. So AI adoption is helping the businesses that left Bitcoin, and says little about Bitcoin's own demand.
One thing we cannot say is that AI adoption is lifting or depressing Bitcoin's price directly. The data support an indirect effect through sentiment on bad days and through competition for speculative money; they do not support a claim that AI use creates demand for Bitcoin.
06 · Bitcoin and the macro backdrop
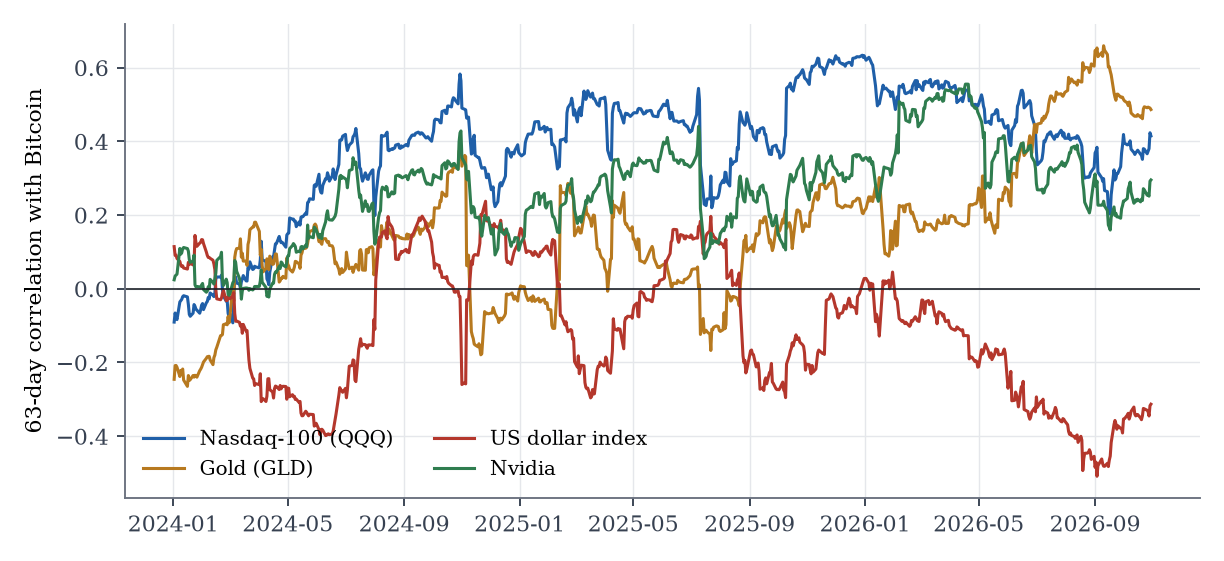
| Against Bitcoin | Last 21 days | Last 63 days | Last 126 days | Last 252 days | 2021 to 2026 |
|---|---|---|---|---|---|
| Nasdaq-100 (QQQ) | +0.57 | +0.41 | +0.40 | +0.44 | +0.38 |
| S&P 500 (SPY) | +0.55 | +0.42 | +0.40 | +0.46 | +0.37 |
| Nvidia | +0.52 | +0.30 | +0.31 | +0.37 | +0.30 |
| Semiconductors (SMH) | +0.48 | +0.31 | +0.28 | +0.35 | +0.32 |
| Gold (GLD) | +0.54 | +0.49 | +0.51 | +0.31 | +0.11 |
| US dollar index | -0.13 | -0.31 | -0.34 | -0.19 | -0.15 |
| Long Treasuries (TLT) | -0.37 | +0.06 | +0.06 | +0.05 | -0.00 |
| 10-year yield change | +0.50 | -0.00 | -0.07 | -0.01 | -0.02 |
| VIX change | -0.44 | -0.29 | -0.32 | -0.39 | -0.33 |
| High-yield credit (HYG) | +0.24 | +0.26 | +0.31 | +0.31 | +0.31 |
| Strategy (MSTR) | +0.66 | +0.81 | +0.79 | +0.81 | +0.72 |
| Coinbase | +0.57 | +0.75 | +0.74 | +0.75 | +0.58 |
| Ether | +0.95 | +0.88 | +0.89 | +0.92 | +0.81 |
Three things stand out. First, Bitcoin trades with equities: the correlation with QQQ has been 0.44 to 0.57 across windows, against 0.38 since 2021. Second, the link with gold is new: 0.49 over 63 days against 0.11 since 2021. Both fell on the hot CPI print (gold lost about 1.5 per cent that day) and both are sensitive to real yields and the dollar, but the dollar link is only -0.31. Third, Bitcoin's co-movement with Strategy (0.79) and Coinbase (0.74) is much higher than with anything macro, which is expected: they are Bitcoin businesses.
6.1 How much of the fall do these links explain?
A high correlation says Bitcoin moves with the Nasdaq from day to day. It does not say that the Nasdaq explains where Bitcoin is. To separate the two, we regress Bitcoin's daily returns on the daily returns of QQQ and the dollar index and the change in the 10-year yield (standard errors robust to autocorrelation, five lags), then add up each factor's contribution over the window.
| Window | R² | QQQ beta (t) | Dollar beta (t) | 10 bp yield (t) | Factors | Unexplained | Bitcoin |
|---|---|---|---|---|---|---|---|
| 252 days | 0.21 | 0.92 (5.4) | -1.0 (-1.5) | +0.6% (1.1) | +12% | -38% | -26% |
| 126 days | 0.23 | 0.57 (3.6) | -2.4 (-2.7) | +0.5% (1.3) | -4% | +6% | +2% |
| 63 days | 0.28 | 0.81 (3.4) | -2.9 (-2.3) | +0.6% (1.3) | -5% | +26% | +21% |
The Nasdaq link is statistically solid (beta about 0.9, t = 5.4 over 252 days) and the dollar link has the expected sign. The model explains 21% of daily variation. Over the 252 days the factors together add up to +12% (the Nasdaq rose), while Bitcoin fell 26%: about 38% of the decline has no macro explanation. In the last 63 days the picture reverses: Bitcoin rose 21% against a factor contribution of -5%, so the summer rebound was also unexplained. A fair reading is that macro and tech conditions move Bitcoin around a path that is set by crypto-specific demand.
07 · Regulation and policy
US policy is a slow driver. The GENIUS Act, which sets rules for payment stablecoins, is law. The CLARITY Act, which would set the market structure for digital assets and split authority between the SEC and the CFTC, passed the House in July 2025 but failed a Senate procedural vote 49 to 50 on 15 September 2026 (60 were needed). Accounts differ on whether it is dead; the more careful reports call it stalled and say it would have to restart in the new Congress after the 3 November midterm elections. In the meantime the regulators are moving on their own: the SEC proposed Regulation Crypto Assets in August (comments closed 20 October) and the CFTC began rulemaking on 5 October for retail leveraged crypto trading. Rules made by agencies are quicker to arrive and easier for a later administration to reverse, which is why the industry wanted the statute.
The market treated the Senate vote as a small negative: Bitcoin fell 3.3% on 15 September (z = -1.6) and was +10% 20 days later, so the rebound ignored it. The hack adds a regulatory angle of its own. A theft of this size from the largest exchange will bring calls for custody and security standards and renewed scrutiny of offshore platforms, which could slow the opening of US markets to crypto. We have no evidence yet on that and treat it as a risk, not a forecast.
08 · Demand, flows and positioning
This section rests on third-party reports, not our own data, and the sources do not always agree. The reports that agree are as follows.
- Exchange-traded funds. US spot Bitcoin funds took in about US$440 million in the week to 29 October and US$305 million the week before, after outflows of about US$773 million on 22 and 23 October. Flows follow price: one study found a correlation of 0.54 with the previous five days' returns and 0.03 with the following five, so they are a symptom more than a signal.
- Premium and spot demand. The Coinbase price premium has been at a small discount (about -0.1 per cent) for most of three months, which analysts read as weak US spot demand.
- Treasury companies. Strategy bought nothing in the latest week; Strive bought 6,182 BTC. Strategy's market value relative to its holdings fell to or below one in mid-2026, and a source reports it sold 3,588 coins in July. Strategy's shares are 64% below the level at Bitcoin's peak, against Bitcoin's 38%. The leverage that carried these firms up works in reverse.
- Derivatives. Futures open interest was about US$47.9 billion on 21 October with funding near 5 to 7 per cent a year, which is far below the 27 per cent before the October 2025 crash. Liquidations of about US$1.3 to 1.5 billion followed the hack. Another report cited US$140 billion in total open interest including options, which cannot be reconciled with the futures number without knowing what it includes.
- Volatility. Bitcoin's 30-day realised volatility was 28% a year before the hack, in the lowest 9% of its 16-year history (median 59%). Calm markets with leveraged positions and a sudden shock is the pattern behind most liquidation cascades.
09 · The technical picture
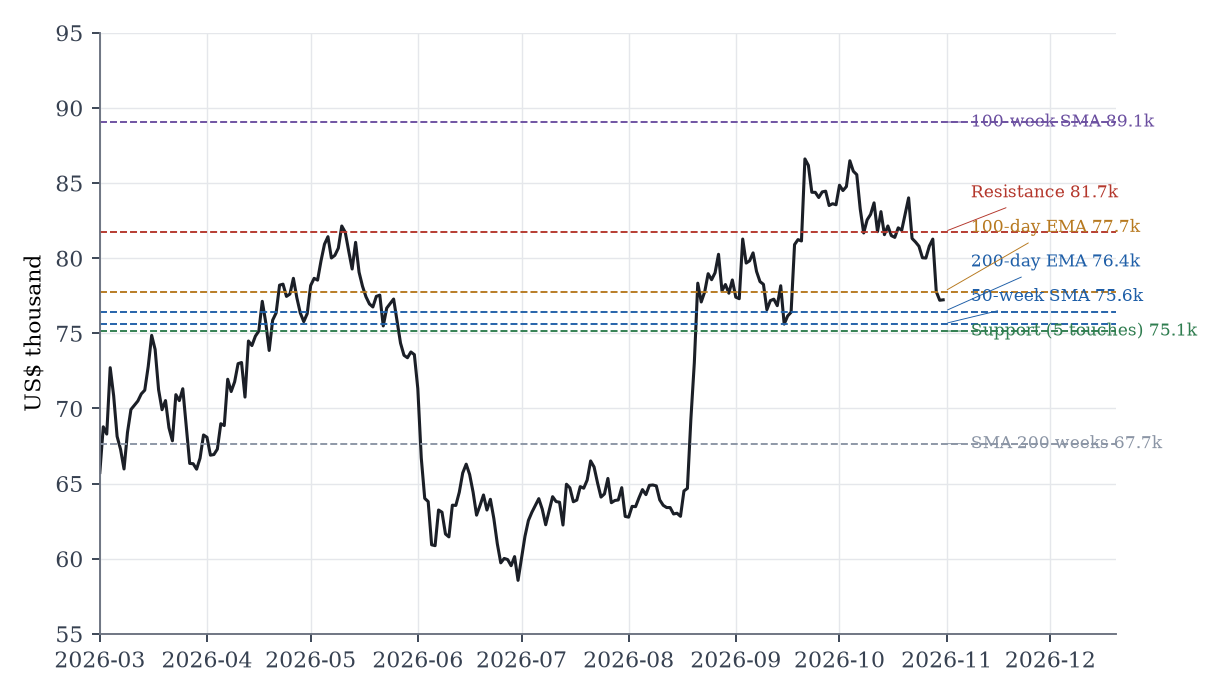
| Reference | Level (US$) | Distance from price | Role |
|---|---|---|---|
| 100-week SMA | 89,059 | +15.3% | Resistance |
| Resistance zone (2 touches) | 88,312 | +14.4% | Resistance |
| Resistance zone (2 touches) | 81,726 | +5.8% | Resistance |
| 20-day EMA | 80,582 | +4.3% | Resistance |
| 50-day EMA | 80,377 | +4.1% | Resistance |
| 100-day EMA | 77,742 | +0.7% | Resistance (just above) |
| 200-day EMA | 76,424 | -1.0% | Support (just below) |
| 50-week SMA | 75,620 | -2.1% | Support |
| Support zone (5 touches) | 75,149 | -2.7% | Support |
| Support zone (3 touches) | 71,550 | -7.4% | Support |
| 200-week SMA | 67,657 | -12.4% | Support |
| Support zone (3 touches) | 65,626 | -15.0% | Support |
The price is 3.9% below its 50-day exponential average and 1.0% above its 200-day exponential average (the same lines as the table and figure), and 2.0% below its 100-week exponential average, the line used in the stretch test elsewhere in this series. The 14-day RSI is 34, close to the oversold line of 30; the weekly RSI is 51, neutral. The 50-day simple average has been above the 200-day simple average for 53 days (a golden cross), so trend followers are not yet out. The cluster of support between US$75,000 and US$76,500 (the 200-day EMA, the 50-week average and a five-touch zone) is where this week's low of about US$76,500 stopped, so a decisive close under US$75,000 would break three references at once and point to the 200-week average near US$67,700. On the upside, US$80,400 to 81,700 (the 20- and 50-day averages and a resistance zone) must be reclaimed first.
9.1 Do the chart claims work on Bitcoin?
| Claim | On now? | Up after: signal vs comparable | Gap vs chance range (pts) | Looks | Verdict |
|---|---|---|---|---|---|
| RSI 30 or less: rises in 3 months | no | 57% vs 52% | +5 vs -15 to +16 | 21 | not distinct |
| 10% below 200-day average: rises in 6 months | no | 47% vs 60% | -13 vs -45 to +46 | 9 | not distinct |
| Down 20% in a month: rises in 3 months | no | 53% vs 53% | +0 vs -20 to +22 | 21 | not distinct |
| 30% below 52-week high: rises in 6 months | no | 50% vs 71% | -21 vs -62 to +64 | 8 | not distinct |
None of the four stands out from chance. Each result has the same shape: the signal looks no better than comparable days, and the range that chance alone produces (plus or minus 15 to 60 points) is wide because Bitcoin's 16 years contain only 8 to 21 independent looks at these horizons. That does not mean the signals are useless; it means the history cannot tell. The right use of a level like US$75,000 is as a risk marker, a price at which an investor's thesis is tested, not as a reason to expect a bounce.
The same machinery on the 100-week-average stretch claim gives the answer 'unclear': in its stretchiest fifth, Bitcoin fell 20 per cent or more within a year in 51% of weeks against 50% in other weeks above the average, a difference of +1 points that the 700 weekly observations are too few to separate from chance.
9.2 What the academic result on trends says, and what we found for Bitcoin
The best-known academic result on price trends points the opposite way from 'buy the dip'. Moskowitz, Ooi and Pedersen (2012) found time-series momentum across 58 liquid futures contracts in equity indices, currencies, commodities and bonds: an asset's own return over the past year tended to continue over the following months, before partly reversing over longer horizons.
We tested that idea on Bitcoin ourselves, using data to 29 October 2026. A 12-month momentum rule (hold Bitcoin when its previous 252-day return is positive, otherwise hold cash) and five other trend and volatility rules were run on Bitcoin in Australian dollars from November 2015, net of 25 basis points a trade, with twelve tests fixed in advance and corrected for multiple testing. The momentum rule kept almost all of Bitcoin's return (65.5% a year against 65.3% for buy-and-hold) and its Sharpe ratio was 1.12 against 1.07, a difference of +0.05 that cannot be told apart from zero (95% interval -0.24 to +0.35). It cut the worst fall only from 82% to 79%. It was ahead of buy-and-hold in 2020 to 2026 (Sharpe 1.03 against 0.85) and behind it in 2014 to 2019 (1.27 against 1.36), and none of the six rules passed the correction.
That test says nothing about this week, but it frames the signal. Bitcoin's return over the last 252 trading days is -26% (Table 5), which is a negative 12-month momentum signal, while the 50-day average is still above the 200-day average, which trend followers read as still in. Two common trend signals disagree, which is the technical picture in miniature: neither the 'buy the dip' claims in Table 7 nor the trend rules have a result that clears a proper test on Bitcoin's history.
10 · What would change the picture
| Date or trigger | Why it matters | Bullish read | Bearish read |
|---|---|---|---|
| Binance reopening withdrawals | Tests whether the theft becomes a confidence event | Orderly reopening, recoveries from frozen funds, little net outflow | Large withdrawals, loss estimates revised up, other exchanges questioned |
| 3 November: US midterm elections | Decides whether crypto legislation can restart in 2027 | Pro-crypto majority and a clear path for a market-structure bill | Gridlock or a hostile Congress |
| Inflation and jobs data in November | Sets the odds of a December hike | Soft core inflation, hike odds fall | Another hot print, 10-year back above 5.3% |
| December Fed meeting (reported 9 December) | The hike the market has largely priced | Hold or a dovish hike | Hike with a hawkish path |
| Large-cap tech and AI financing | Bitcoin follows tech weakness down more than it follows strength up | AI financing fears ease, Nasdaq steadies | Credit stress in AI-linked borrowers |
| ETF flows and treasury buying | Marginal buyers of the last cycle | Sustained net inflows with price rising | Outflows plus more treasury companies selling |
| Price: US$76,424 to US$75,149 | Three references coincide | Held on a close, with a close above US$82,000 | Close below US$75,000 targets US$67,700 area |
Our own view of the balance, held lightly: the near-term setup is two-sided. Volatility was unusually low before the shock, funding is modest and the technical support is thick, so a forced-selling cascade of the October 2025 kind looks less likely. Against that, the macro weight is on the wrong side (real yields high, a hike likely, tech worries) and the institutional bid that carried the last cycle has not been rebuilt. We would not read much into any one of these because the evidence for any single forecast is weak, which is the main finding of the technical section.
11 · Limits
- Not a forecast or advice. Bitcoin is highly volatile and can lose most of its value. Nothing here is a recommendation to buy, hold or sell.
- News sources. Much of the event reporting comes from crypto-industry media, aggregators and what looks like machine-written copy; several give conflicting figures for the same event. We used numbers that two or more sources agreed on, but have not verified them against filings, exchange statements or on-chain data ourselves. Binance's and Chainalysis's published figures could be revised.
- Causation. Correlation and regression show association. The events table has five unrelated cases, each coincident with other news, so it cannot isolate the effect of any one shock.
- Short history for crypto-specific effects. Three earlier cycles; 16 years of daily data with only 8 to 21 independent looks at these horizons. Tests with this little history have wide ranges.
- Gaps. We could not source a cause for the August 2026 rebound, current ETF and treasury-company holdings from primary data, options positioning for 29 to 31 October, or the status of Binance withdrawals after 30 October.
- Data timing. Bitcoin trades every day; equities, yields and dollar data are US trading days. Prices are daily closes at 00:00 UTC and may differ from other quote sources by a few hundred dollars.
12 · Conclusion
Bitcoin's weakness this week is the product of three things at once: a Fed that sounded more hawkish than the hold, a tech sell-off that Bitcoin currently joins, and a record exchange theft that forced leveraged buyers out. None of them is unusual in size for Bitcoin and none, on the evidence so far, has damaged the market's plumbing. The year's weakness is different. It lies in a loss of crypto-specific demand that the Nasdaq, the dollar and yields do not explain, in AI taking the speculative money, and in the treasury-company model coming under strain. The cycle comparison offers a hopeful sign, with a shallower fall than past cycles, and a cautionary one, with only three past cycles to compare. The next few weeks turn on events that no chart can forecast: Binance's reopening, the election, inflation data and the December meeting.
Appendix A · Sources and reliability
| Topic | Source | Used for | Reliability note |
|---|---|---|---|
| Binance hack | Chainalysis blog (30 Oct); TRM Labs; CNBC and Al Jazeera coverage; Bloomberg | Size, time, method, attribution, freezes | Preliminary: attribution is an assessment; frozen total has no as-of time; sizes differ by US$0.1bn |
| Fed decision | Crypto Times, Brave New Coin, FXStreet weekly forecast | Hold at 3.75-4.00, 10-2 vote, PCE and GDP | Crypto-media summaries; one mention of Bitcoin 'near all-time highs' was inconsistent and ignored |
| CPI and rates | InvestingLive, OrbitRemit, Citi note as reported | CPI 3.7% vs 3.6%, December hike odds | Odds figures vary widely between aggregators; the 10-year level is replaced by our own data |
| AI and tech | 24/7 Wall St (26 Oct), Talos 'State of the Market' (22 Oct) | 22 Oct sell-off; correlations; flows; derivatives; ETF premium | Our own correlations differ from the quoted figures (different windows) |
| Regulation | NPR (15 Sep), FinTech Weekly, other trackers | CLARITY vote 49-50; SEC and CFTC proposals | Trackers disagree on whether the bill is 'dead' |
| Miners and AI | CoinShares (via press), KuCoin blog posts, Bernstein quoted | 70% AI revenue projection; break-even near US$90k | A projection, and several sources are promotional; hash-rate figures conflict |
| Treasury companies | Simple Mining, DEXTools, The Block, Cointelegraph | mNAV under 1; Strategy pause and sales | Definitions of mNAV changed in July; sales figure from a single source |
| Price, yields, equities, gold, dollar | EODHD (Foundry Labs data) | All price, return and correlation statistics | Primary data for this paper |
| June 2026 low and ETF outflows | Bitcoin.com, Analytics Insight, TradingEconomics | Context for the June low | Secondary; dates differ across articles |
A.1 Method notes
- Prices are EODHD daily closes (UTC) for Bitcoin and Ether and US-session closes for other assets. Cross-asset returns are computed between US trading days, so Bitcoin's weekend moves are included in Monday's return.
- Regressions use ordinary least squares with Newey-West standard errors (five lags). Factors are QQQ return, dollar-index return and the 10-year yield change in basis points.
- Event z-scores divide the day's return by the standard deviation of the prior 60 daily returns. 'Days since 2023 below -4.3%' counts calendar days.
- Claim checks use Foundry Labs' event-study checker: flagged days against days in the same long-term trend, a shift test for the chance range, and a confidence bar that rises with the number of claims tried (four here).
- Levels are Foundry Labs' clustered weekly swing points; moving averages are computed from daily and weekly closes.
References
- Moskowitz, T. J., Ooi, Y. H. and Pedersen, L. H. (2012). Time series momentum. Journal of Financial Economics, 104(2), 228-250.
- Newey, W. K. and West, K. D. (1987). A simple, positive semi-definite, heteroskedasticity and autocorrelation consistent covariance matrix. Econometrica, 55(3), 703-708.
General information only. Figures are historical and in the currency stated in each section. Past results, even on honest data, do not predict future returns. Nothing here is financial, tax or investment advice. © Foundry Labs 2026.